|
ABOUT MOTOR INTELLIGENCE
Founded in 1990, Autodata Corporation and its Motor Intelligence group are the world's leading provider of vehicle sales and leasing data for the United States market.
Motor Intelligence's analysis and information have helped vehicle manufacturers and financial analysts know where each model stacks up against the competition since 1990.
We specialize in the online distribution of statistical data, market intelligence, and customizable management reports. Our information is widely used by OEMs, Wall Street analysts, financial institutions, and media throughout the world.
Customized outsourced solutions are also available.
We value each of our long-standing business relationships and view them as a testament to our quality of work.
Our mission at Motor Intelligence is to best serve our clients by delivering high quality and timely market analysis tools, partnered with the best customer service in the industry.
|
 Reports & Services
Email info@motorintelligence.com or call (201) 307-1000
for more information or to subscribe to any of the reports below.
PREMIUM REPORTS & SERVICES
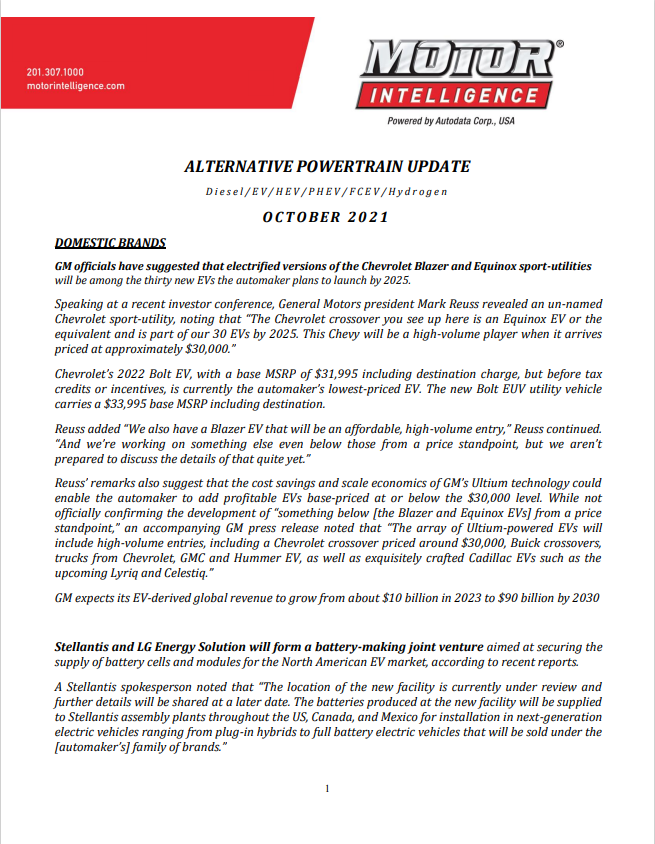
Monthly Alternative Powertrain Report
$2,400 Annually
CLICK TO OPEN IN NEW TAB
Monthly Alternative Powertrain Report provides industry summaries and insights for key alternative drive (EV, HEV, PHEV, FCEV, Diesel, Hydrogen, ...) vehicles, specifically on siginificant:
- Manufacturer Technology, Direction & Production Ramp-ups
- Joint-Ventures & Industry Investments
- Academia Highlights & Advancements
- Supplier / Purchaser Shifts
- Government Regulations
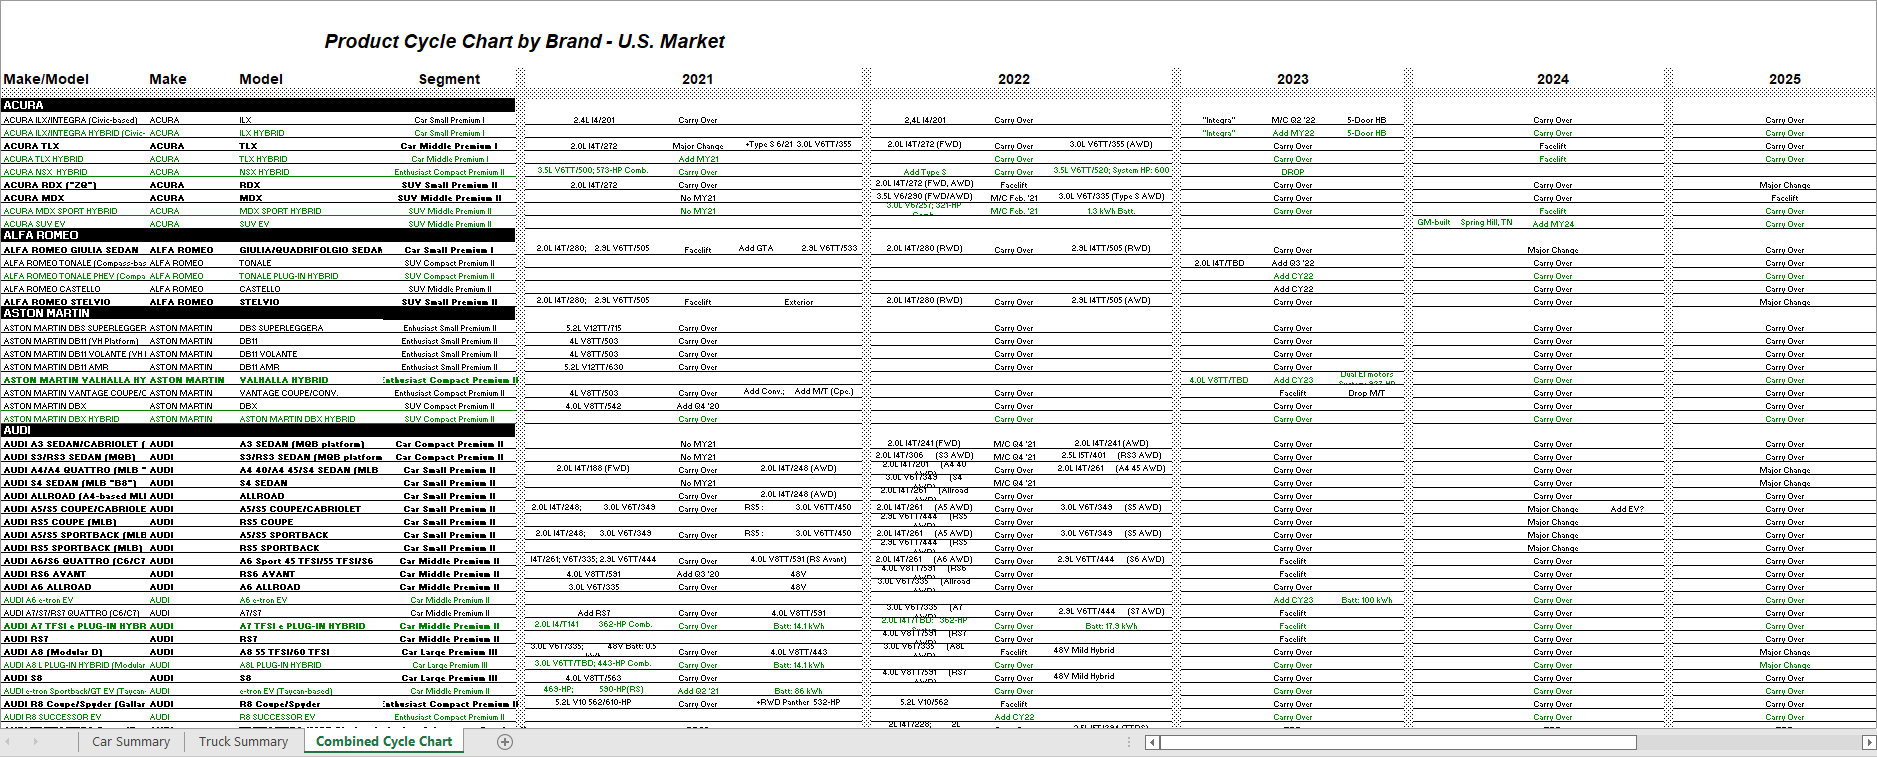
Quarterly Product Cycle Charts
$2,400 Annually
CLICK TO OPEN IN NEW TAB
Quarterly product cycle charts of models by brand help understand manufacturer trends, direction and timelines up to 5 years in the future! This report calls out major and minor model refreshes to:
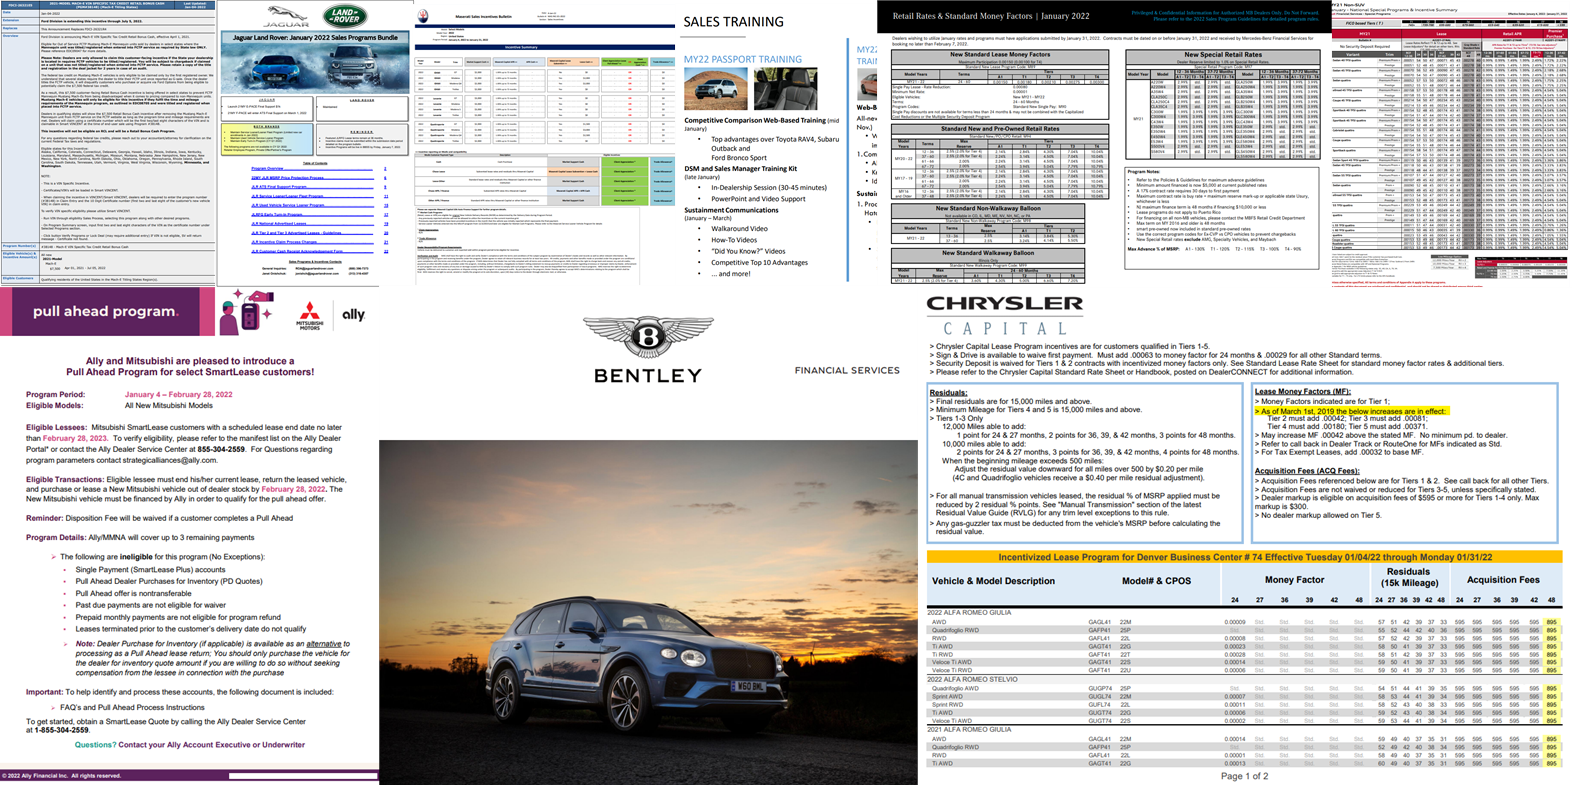
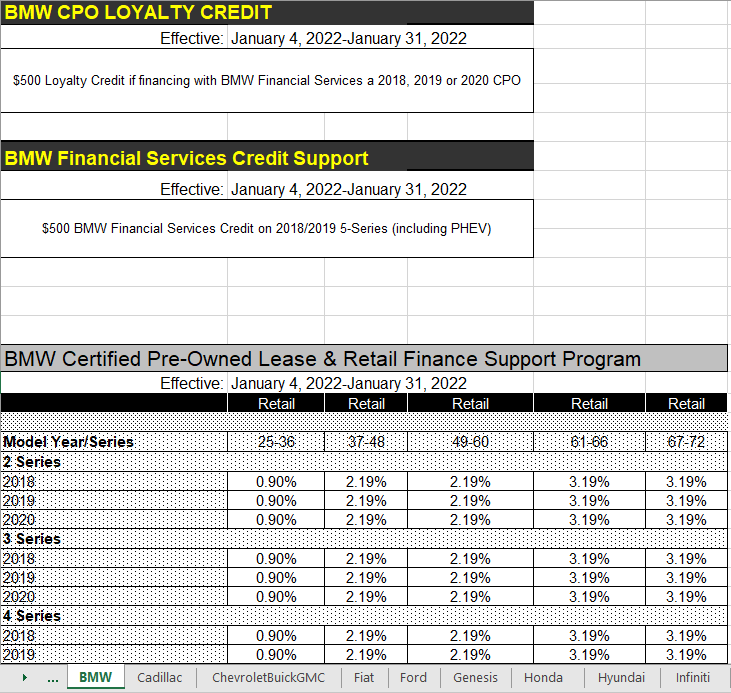
Manufacturer / Finance Company Program Bulletins
Contact Us for Details and Service Options
CLICK TO OPEN IN NEW TAB
Monthly in-depth manufacturer and finance company program bulletins detailing dealer and consumer:
- Bonus
- Lease Programs
- Retail Programs
- Finance Programs
- Dealer Items of Interest
Custom Reporting & Analytics
Contact Us for Details and Service Options
CLICK TO OPEN IN NEW TAB
Sometimes your data needs require more detail or analysis than our à la carte offerings. Our customized solutions (our data -> your way) can help with:
- Custom Design / Maintenence / Preperation / Validation / Delivery of your Internal Reports
- In-Depth Competitive Research on How Models / Brands Stack Up Against their Competition
- Ad-Hoc data Analytics for your Unpredictable Strategic Planning Needs
- Custom Dashboard Design, Integration or Hosting
- General Industry Research & Reporting
ONLINE ACCESS
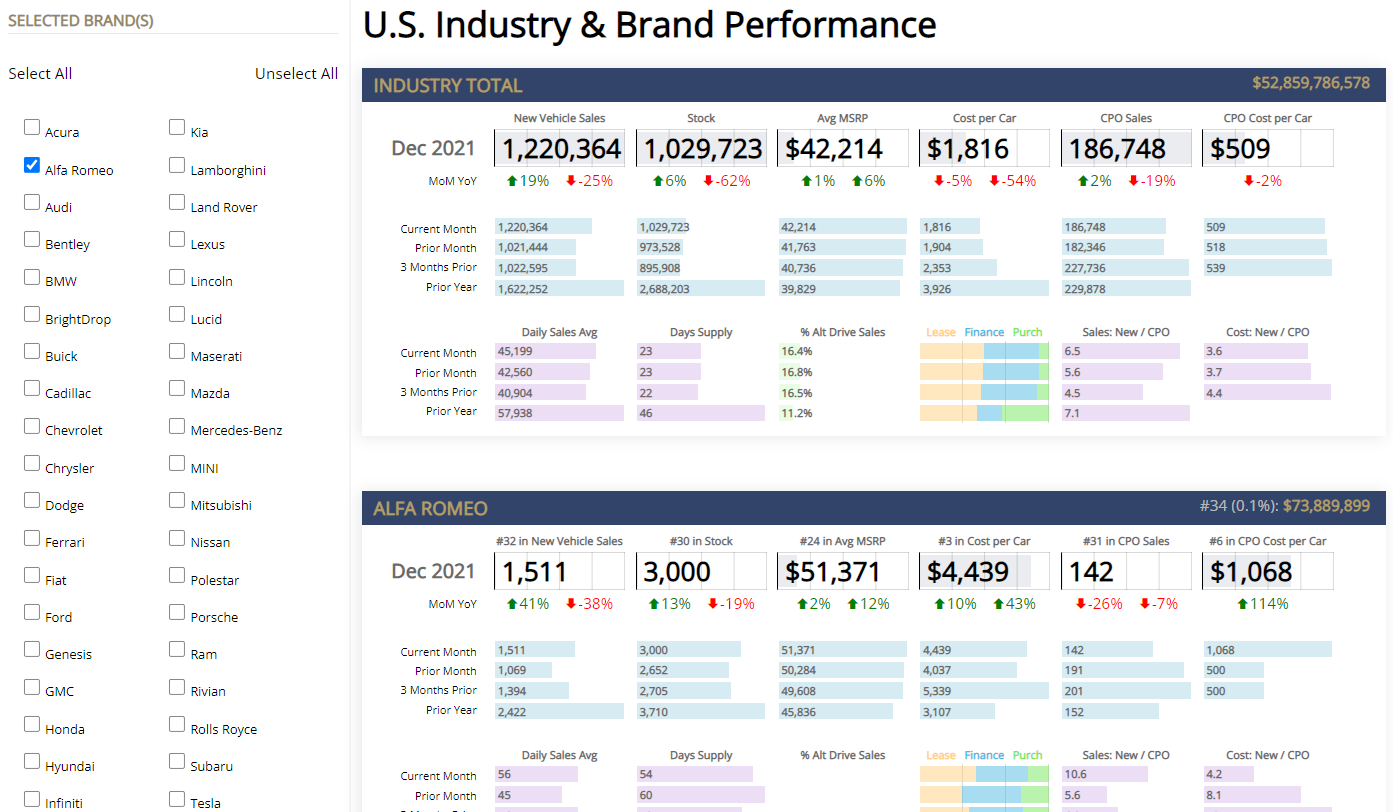
Motor Intelligence System Online Access
Contact Us for Details and Service Options
CLICK TO OPEN IN NEW TAB
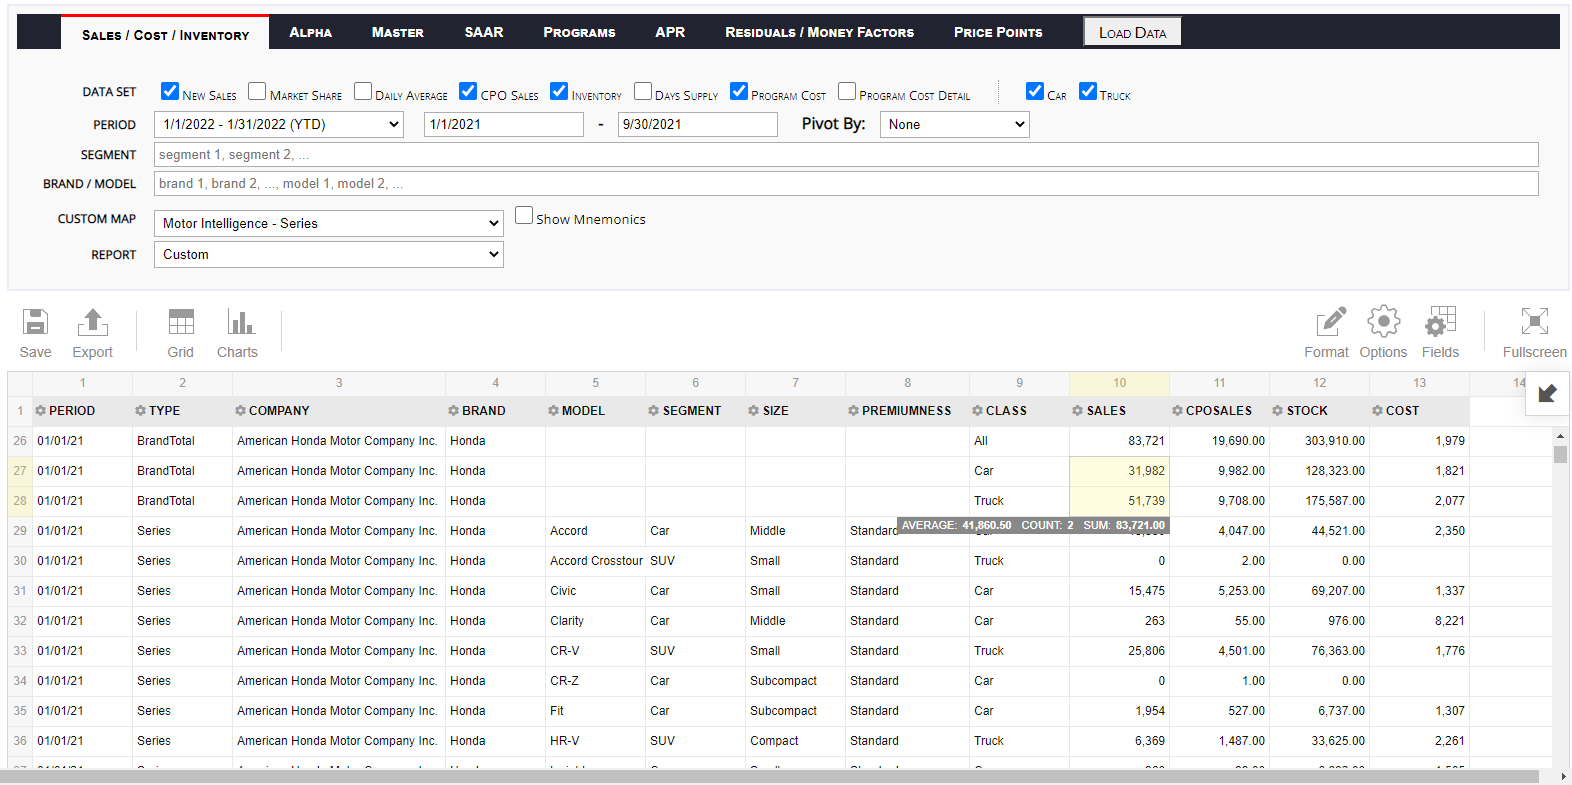
The Motor Intelligence System allows you and your colleagues to effortlessly create custom queries dating back to 1990 on our prized new vehicle & pre-owned data sets including:
- SAAR / Sales / Cost / Inventory (Using our Standard or your Custom Segments)
- Incentive Programs (by Type or Region)
- Residuals & Money Factors (by Type or Region)
- Price Points (by Type or Region)
API Access
Contact Us for Details and Service Options
CLICK TO OPEN IN NEW TAB
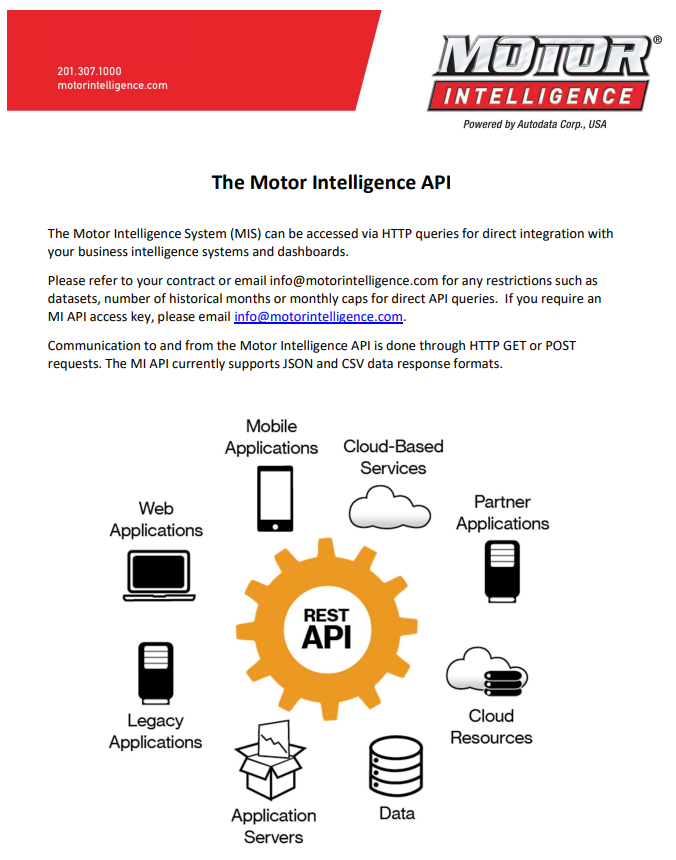
The Motor Intelligence System (MIS) can be accessed via HTTP queries to directly integrate with and refresh your business intelligence systems and dashboards on demand.
Communication with the Motor Intelligence API is done through HTTP GET or POST requests. The MI API currently supports JSON and CSV data response formats.
Refer to the Motor Intelligence API for additional integration details.
INCENTIVE REPORTING
Weekly Incentive News
Contact Us for Details and Service Options
CLICK TO OPEN IN NEW TAB
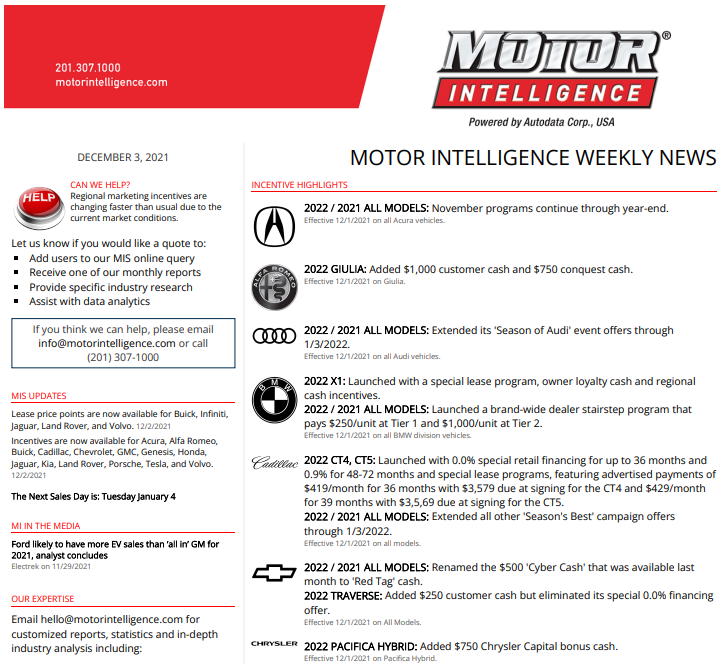
Weekly newsletter covering major manufacturer incentive program and bulletin updates. Includes selected automotive news links to highlight industry articles of interest.
Monthly Marketing Promotions $ Summary Analysis
Incentives Spending Reporting Starting at $7,500
CLICK TO OPEN IN NEW TAB
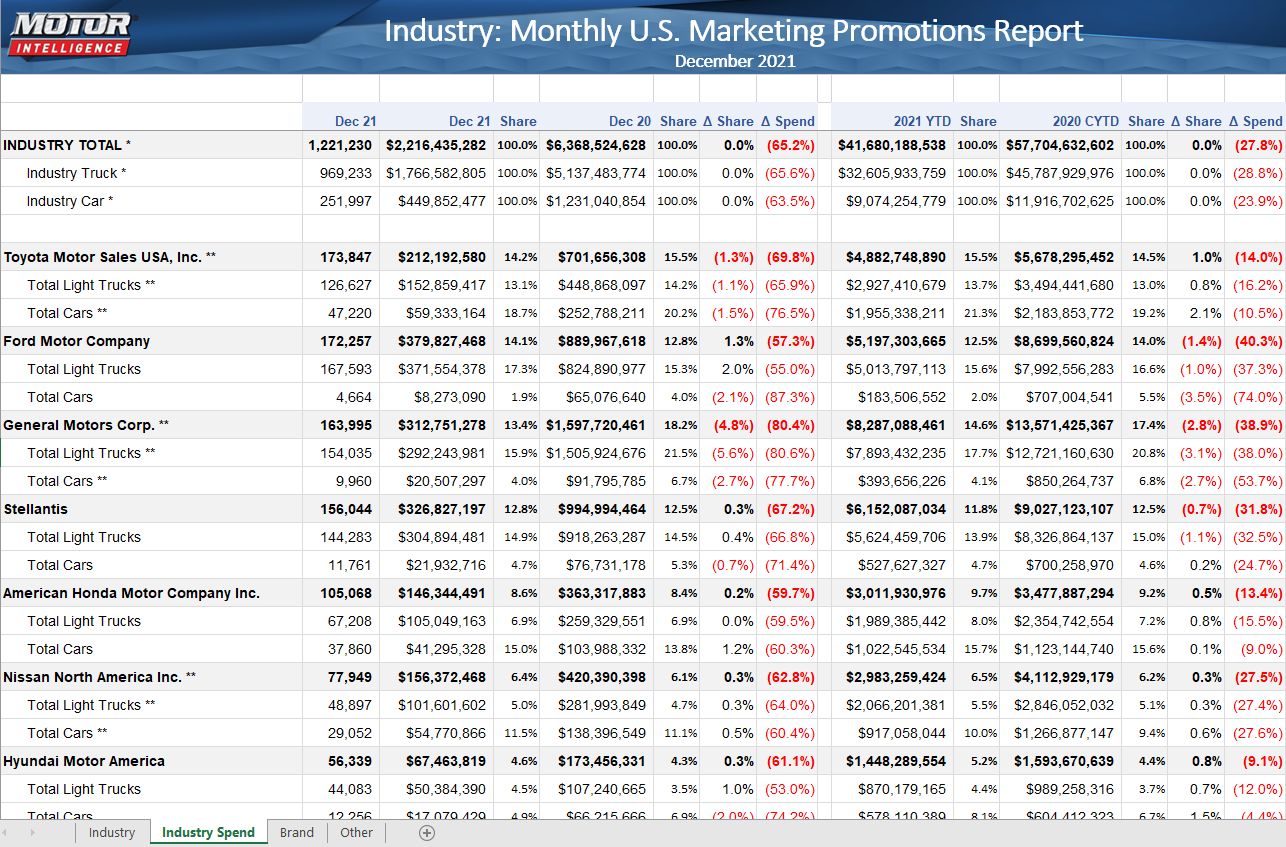
Monthly U.S. new vehicle sales, cost per car, market share, $ & cost percent change over current month & CYTD vs prior year month and year broken out by:
- Car / Truck / Total
- Industry / Corporation / Brand / Series Detail
- Totals for Mfg. Origin
- Special Industry Spend tab highlights $$$ spend for Car / Truck by Manufacturer
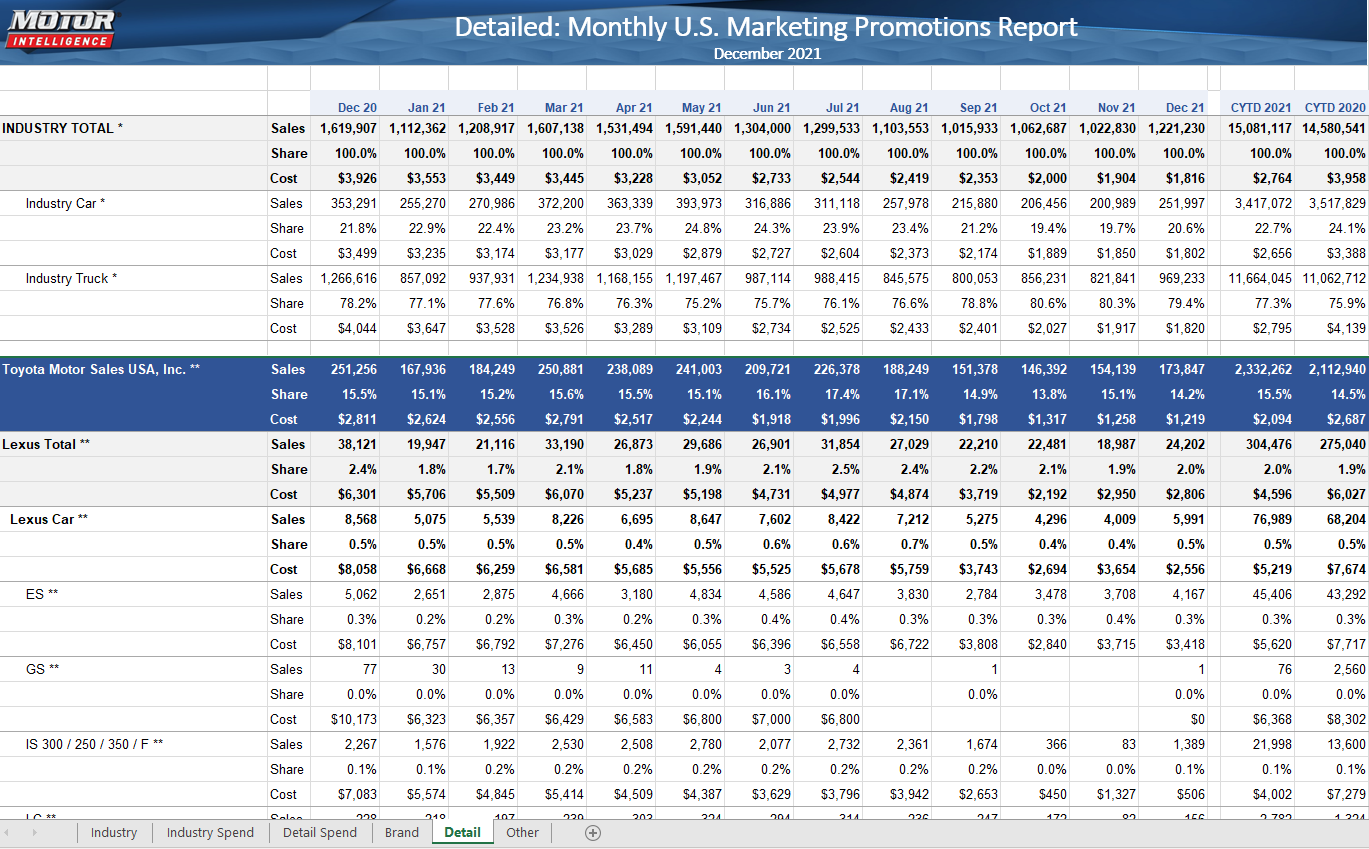
Monthly Marketing Promotions $ Trend Analysis
Incentives Spending Reporting Starting at $7,500
CLICK TO OPEN IN NEW TAB
Same as above Monthly Marketing Promotions $ Summary Analysis with additional series detail breakouts for:
- 13-Month trend tab including sales, cost and market share (inc. current & prior CYTD)
- Detail Spend tab highlights $$$ spend for Car / Truck / Series by Mfg. & Brand
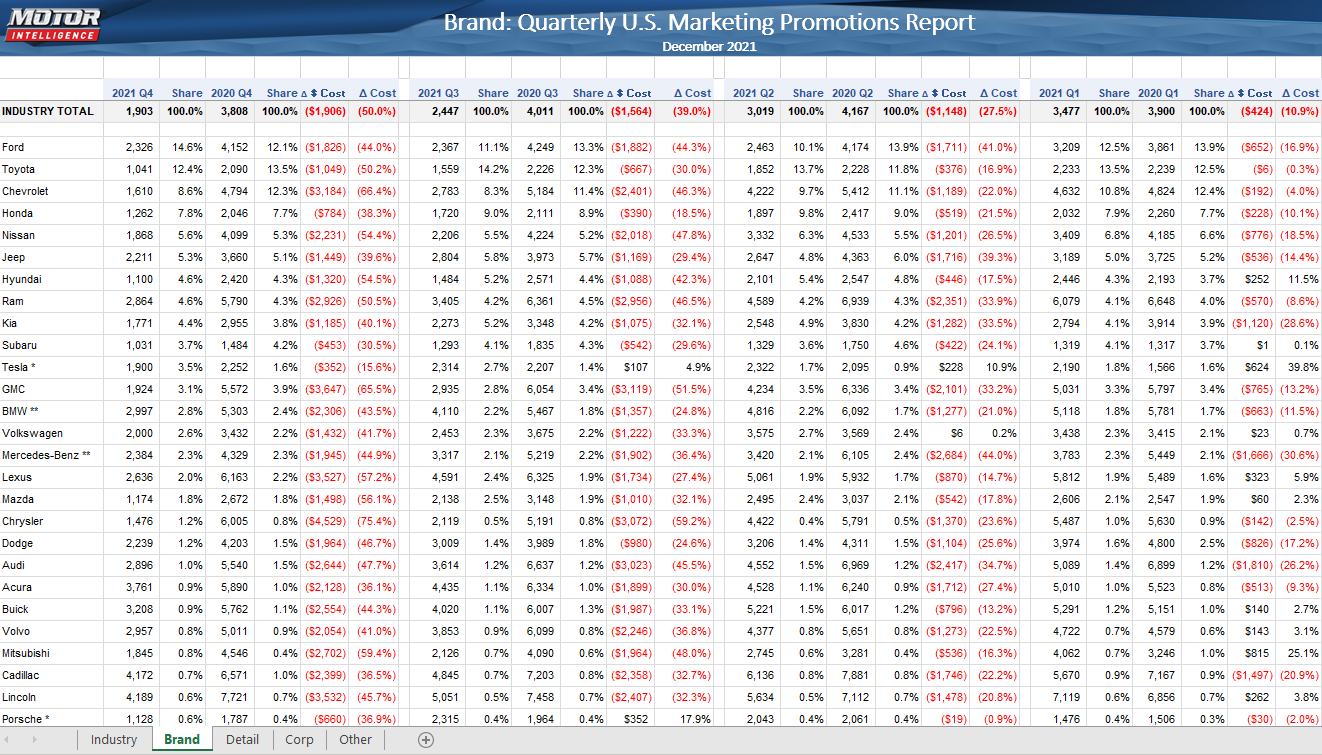
Quarterly U.S. Marketing Promotions Cost Report
Incentives Spending Reporting Starting at $7,500
CLICK TO OPEN IN NEW TAB
Quarterly U.S. new vehicle sales, cost per car, market share, $ & cost percent change over the last 4 quarters broken out by:
- Car / Truck / Total
- Industry / Corporation / Brand / Series Detail
- Totals for Mfg. Origin
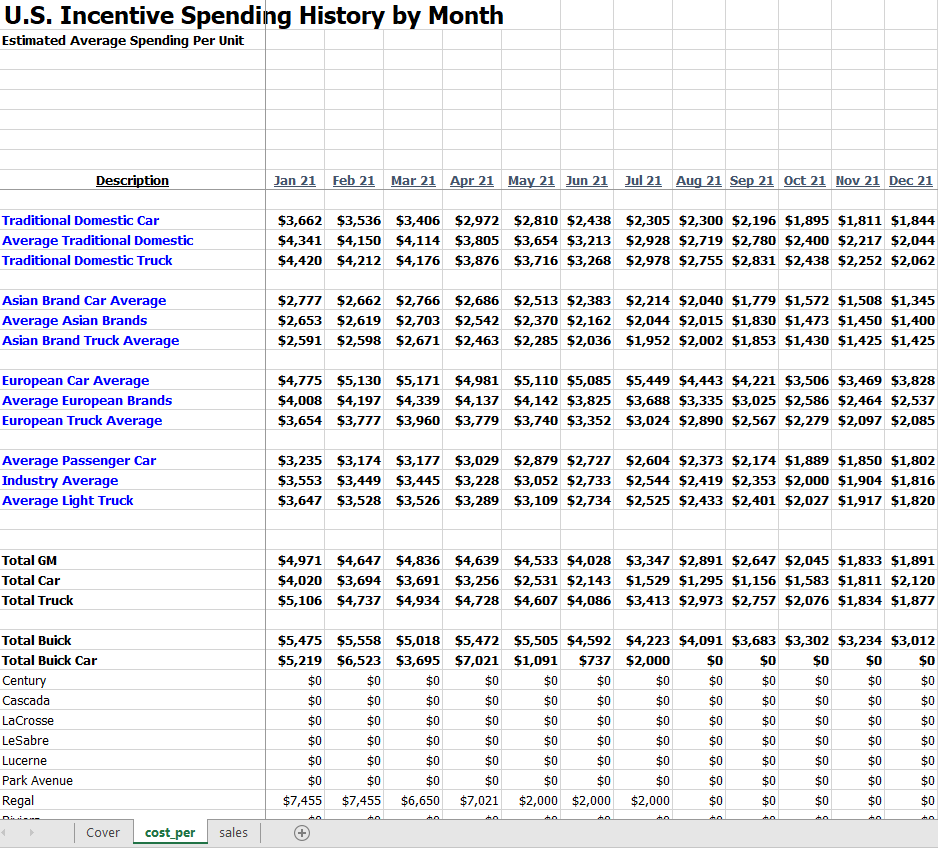
Monthly Incentive Spending History by Month
Incentives Spending Reporting Starting at $7,500
CLICK TO OPEN IN NEW TAB
Monthly average program cost per car advertising spend and unit sales trend by model from January 2003 to current.
- Cost per Car Advertising Spend
- Unit Sales
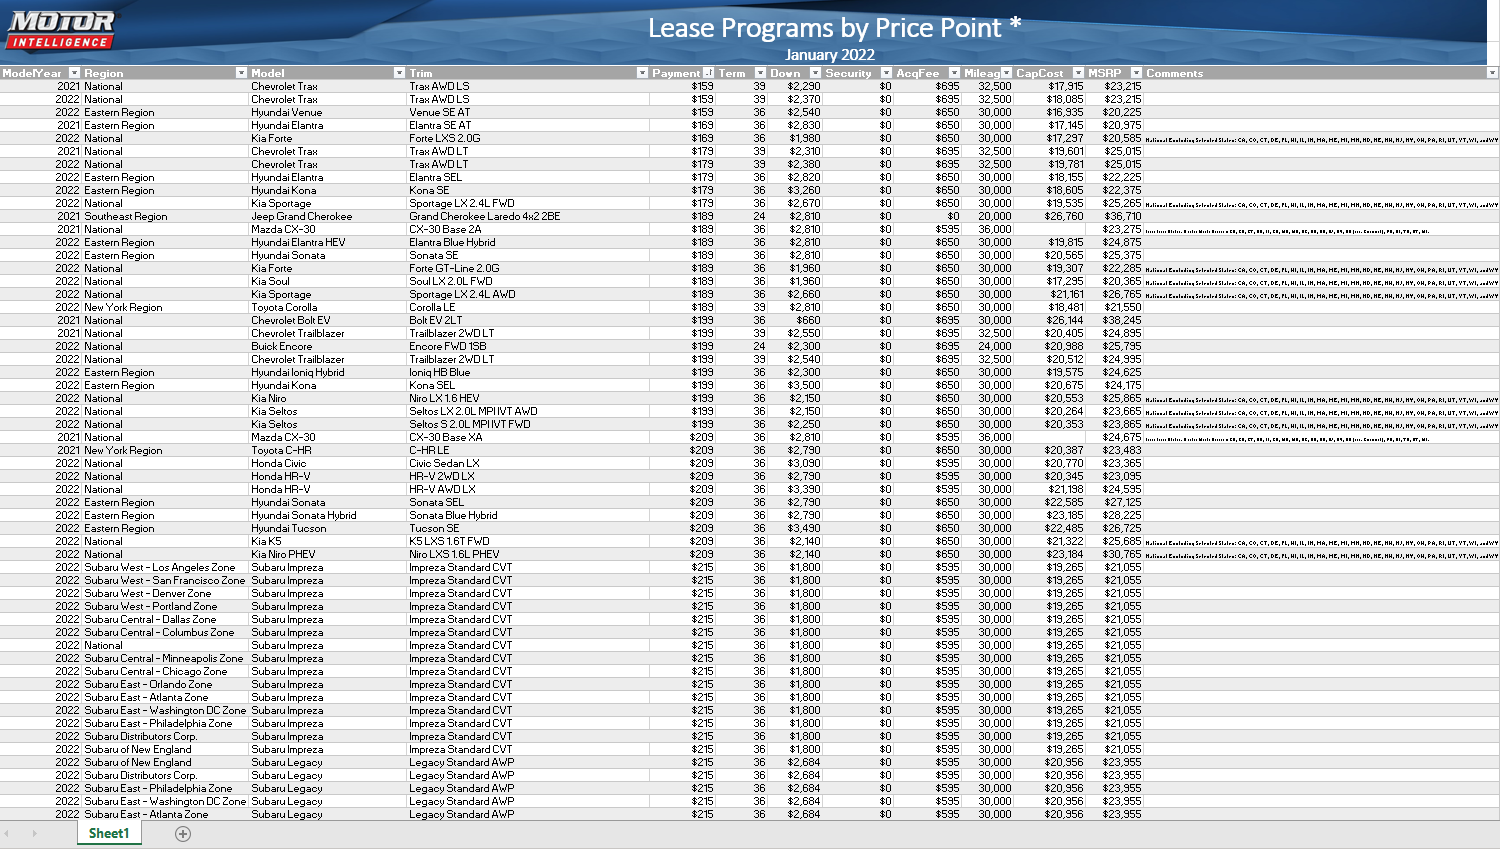
Monthly Advertised Lease Price Points
Incentives Program Details Starting at $10,000
CLICK TO OPEN IN NEW TAB
Monthly best-of-trim lease price points of model rates by region and model year including:
- Term
- Monthly Payment
- Down Payment, Security, Acquisition Fee, Mileage, Cap Cost and MSRP
Monthly Luxury Vehicle Incentives Report
Incentives Program Details Starting at $10,000

CLICK TO OPEN IN NEW TAB
Monthly details and updates to luxury vehicle incentive programs and manufacturer bulletins.
Monthy Luxury Lease Reference
$7,200 Annually
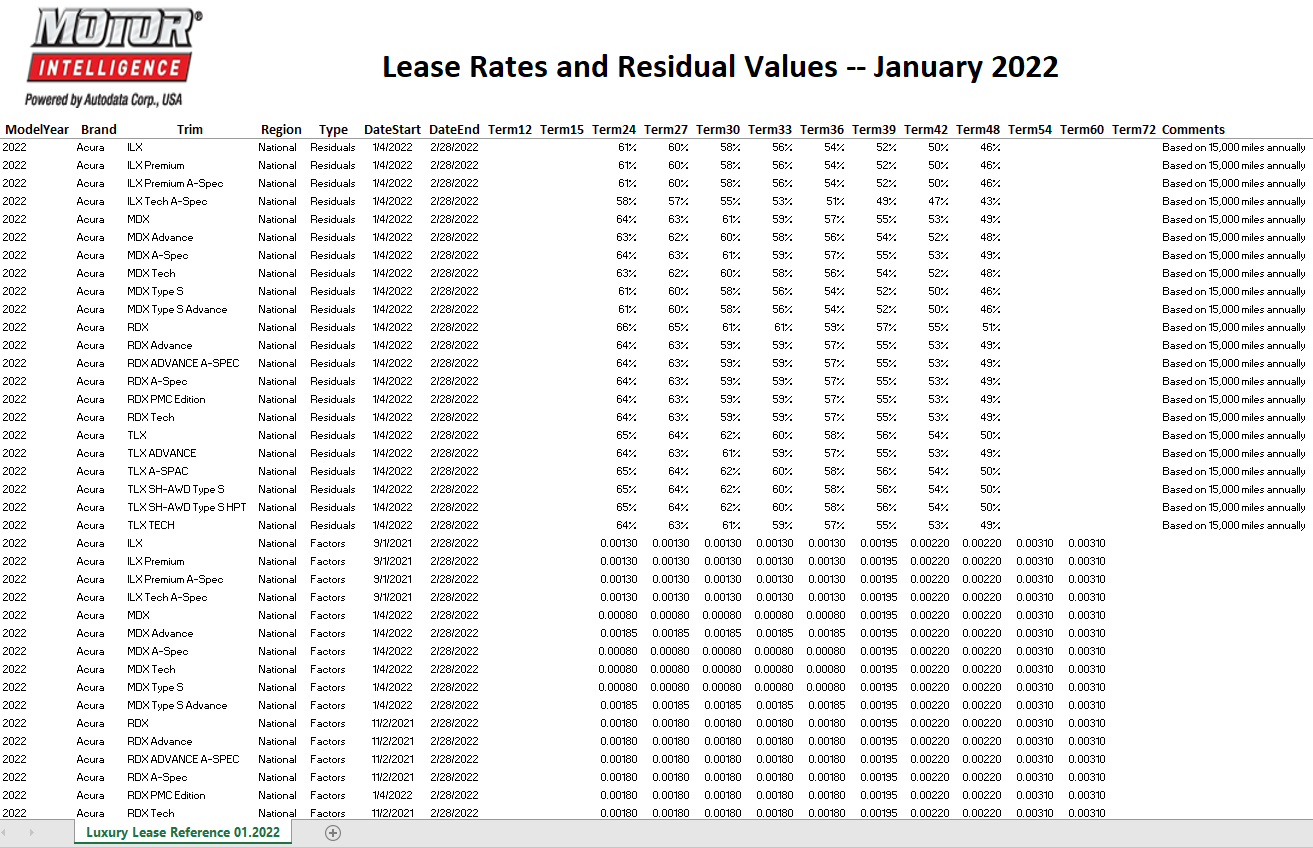
CLICK TO OPEN IN NEW TAB
Monthly reference of luxury vehicle program lease rates and residuals for luxury models and trims by:
- Model Year
- Term Rates
- Program Start & End Dates
Monthly CPO Marketing Promotions $ Trend Analysis
Incentives Spending Reporting Starting at $7,500
CLICK TO OPEN IN NEW TAB
Monthly U.S. new vehicle sales, cost per car, market share, $ & cost percent change over current month & CYTD vs prior year month and year broken out by:
- Car / Truck / Total
- Industry / Brand / Series Detail
- 13-Month trend tab including sales, cost and market share (inc. current & prior CYTD)
Monthly PreOwned Incentives Report
Incentives Program Details starting at $10,000
CLICK TO OPEN IN NEW TAB
Monthly details and updates to PreOwned vehicle incentive programs and manufacturer bulletins.
Survey of U.S. Manufacturer Certified Pre-Owned Programs Update
Incentives Program Details starting at $10,000
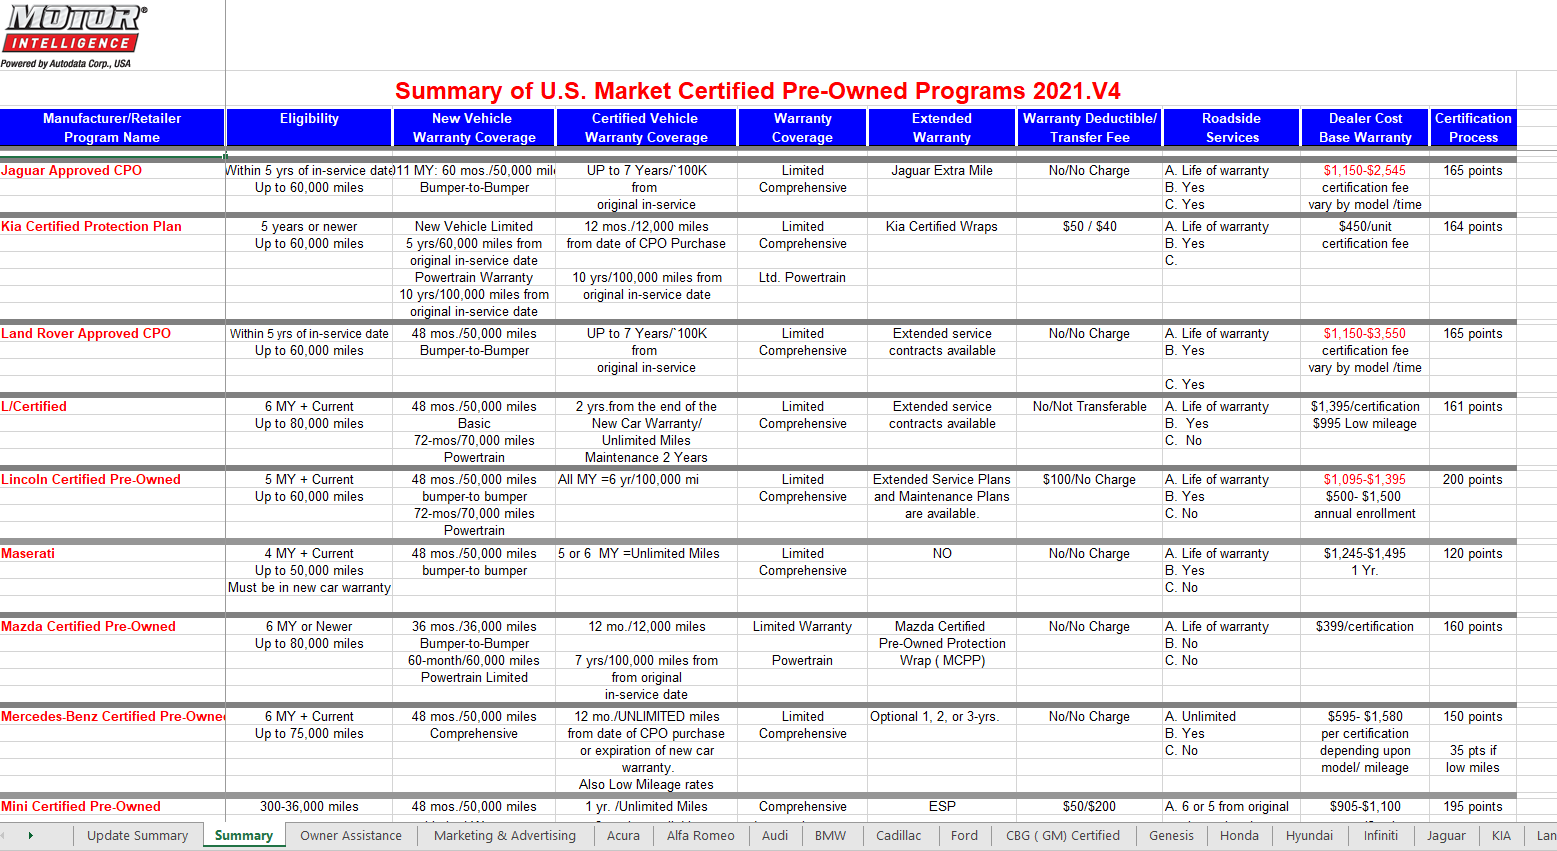
CLICK TO OPEN IN NEW TAB
Periodic survey of CPO comparison and OEM program details including:
- Warranty
- Owner Assistance
- Dealer Assistance
- Marketing & Advertising
- Certified Training & Process
- Program Compliance
SALES REPORTING
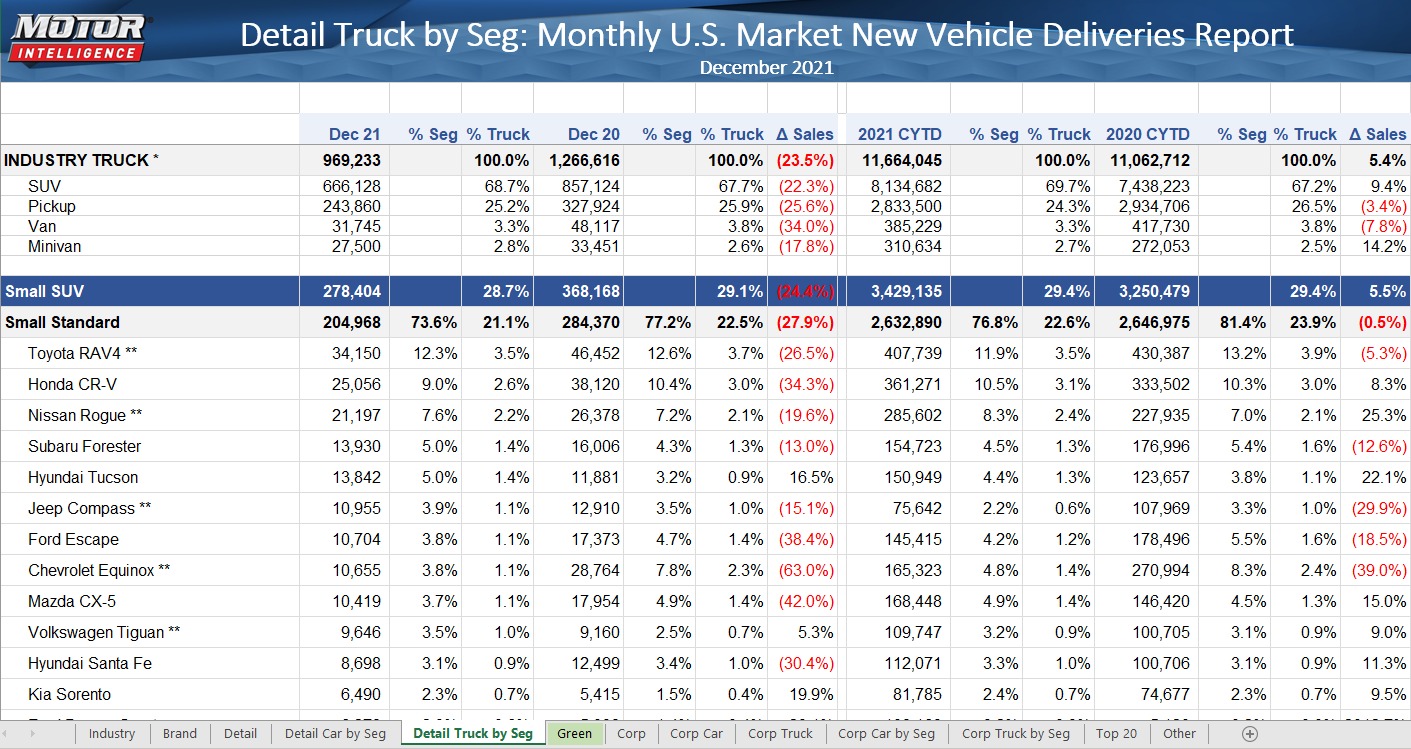
Monthly U.S. Market New Vehicle Deliveries Report
Statistical Reporting Packages Starting at $4,900
CLICK TO OPEN IN NEW TAB
Monthly U.S. new vehicle sales, market share, percent of segment and percent change over current month vs prior year month and current CYTD vs prior year CYTD broken out by:
- Car / Truck / Total
- Industry / Corporation / Brand / Series Detail
- Detailed Statistics of Corporation & Series Car / Truck by Vehicle Segment
- Green Vehicles by Total Market Share and Percent within each Green Segment
- Totals for Heavy Vehicles by Corporation / Mfg. Origin / Transplants / Sourcing by Country
- Top 20 Vehicles
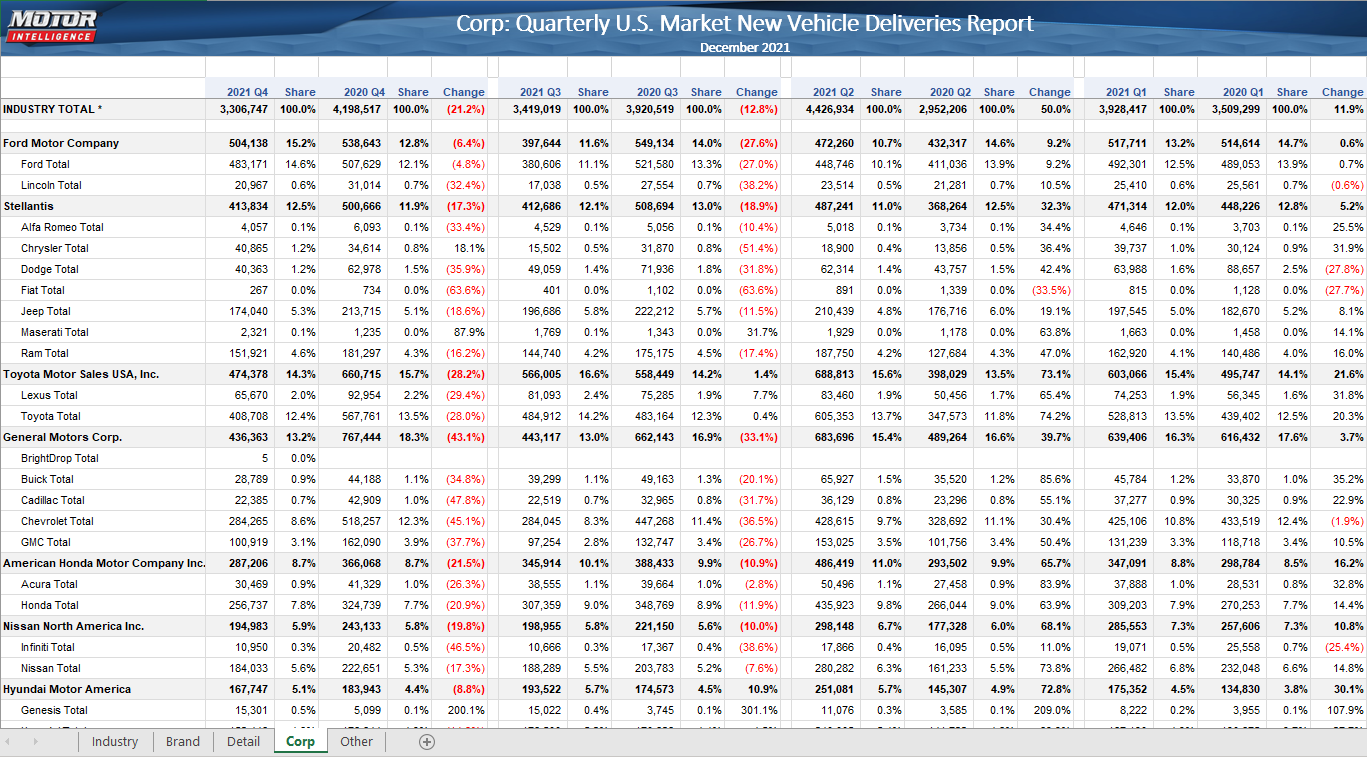
Quarterly U.S. Market New Vehicle Deliveries Report
Statistical Reporting Packages Starting at $4,900
CLICK TO OPEN IN NEW TAB
Quarterly U.S. new vehicle sales, market share and percent change over the last 4 quarters broken out by:
- Car / Truck / Total
- Industry / Corporation / Brand / Series Detail
- Totals for Heavy Vehicles by Corporation / Mfg. Origin Transplants / Sourcing by Country
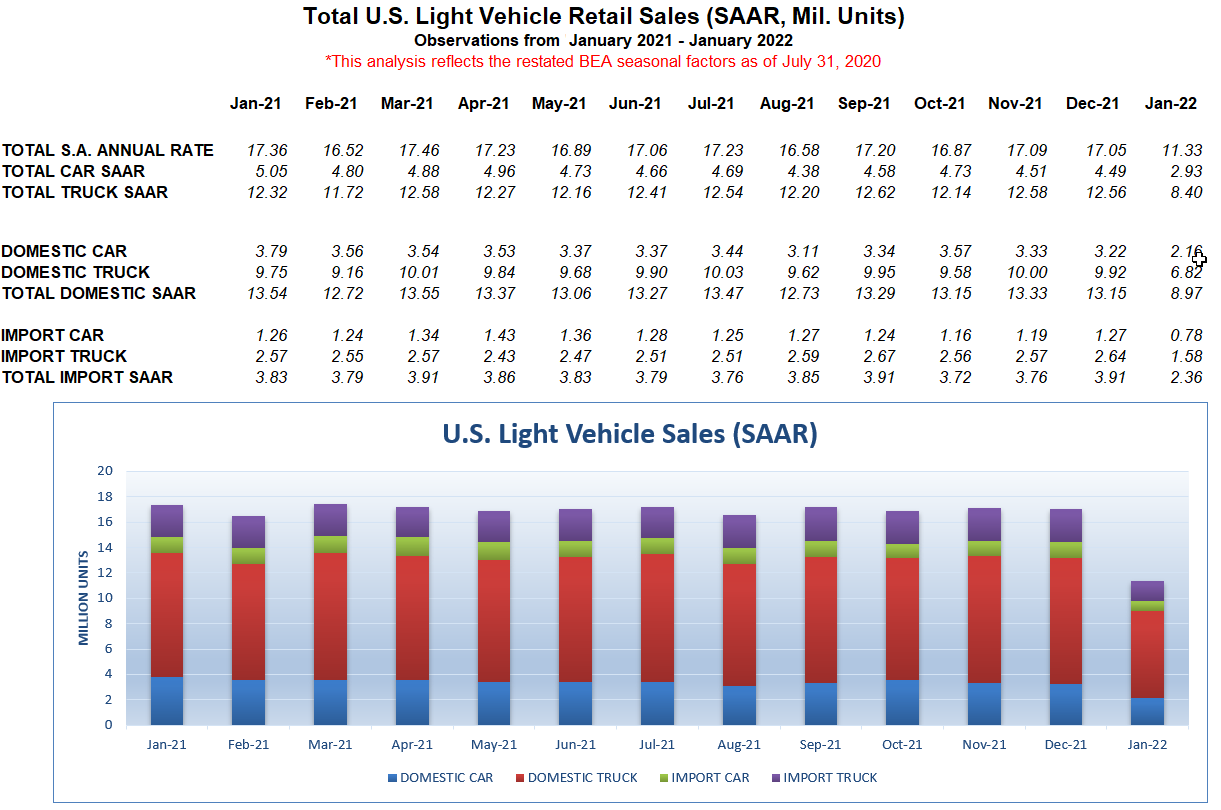
Monthly SAAR Update
$1,200 Annually
CLICK TO OPEN IN NEW TAB
Industry 13-month SAAR (Seasonally Adjusted Annual Rate) trend using BEA's seasonal factors broken out by:
- Car / Truck / Total
- Domestic / Import
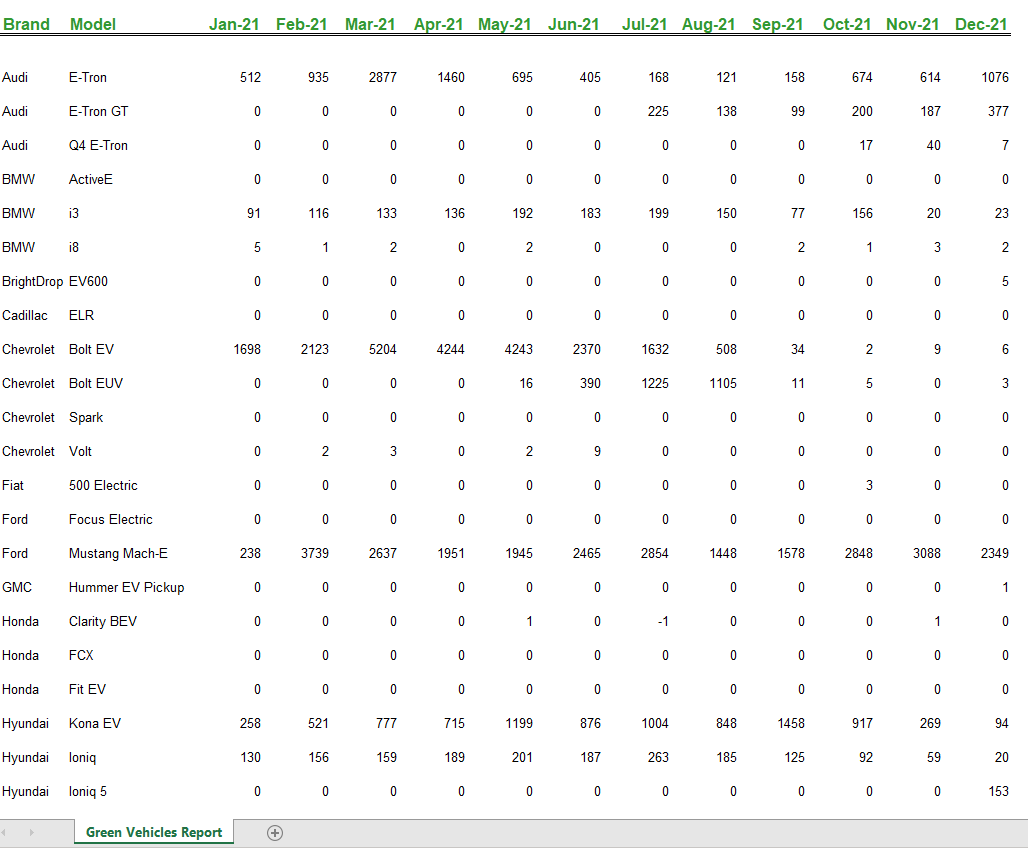
Monthly U.S. Green Vehicles Report
$1,200 Annually
CLICK TO OPEN IN NEW TAB
CYTD sales trend of green energy vehicle sales.
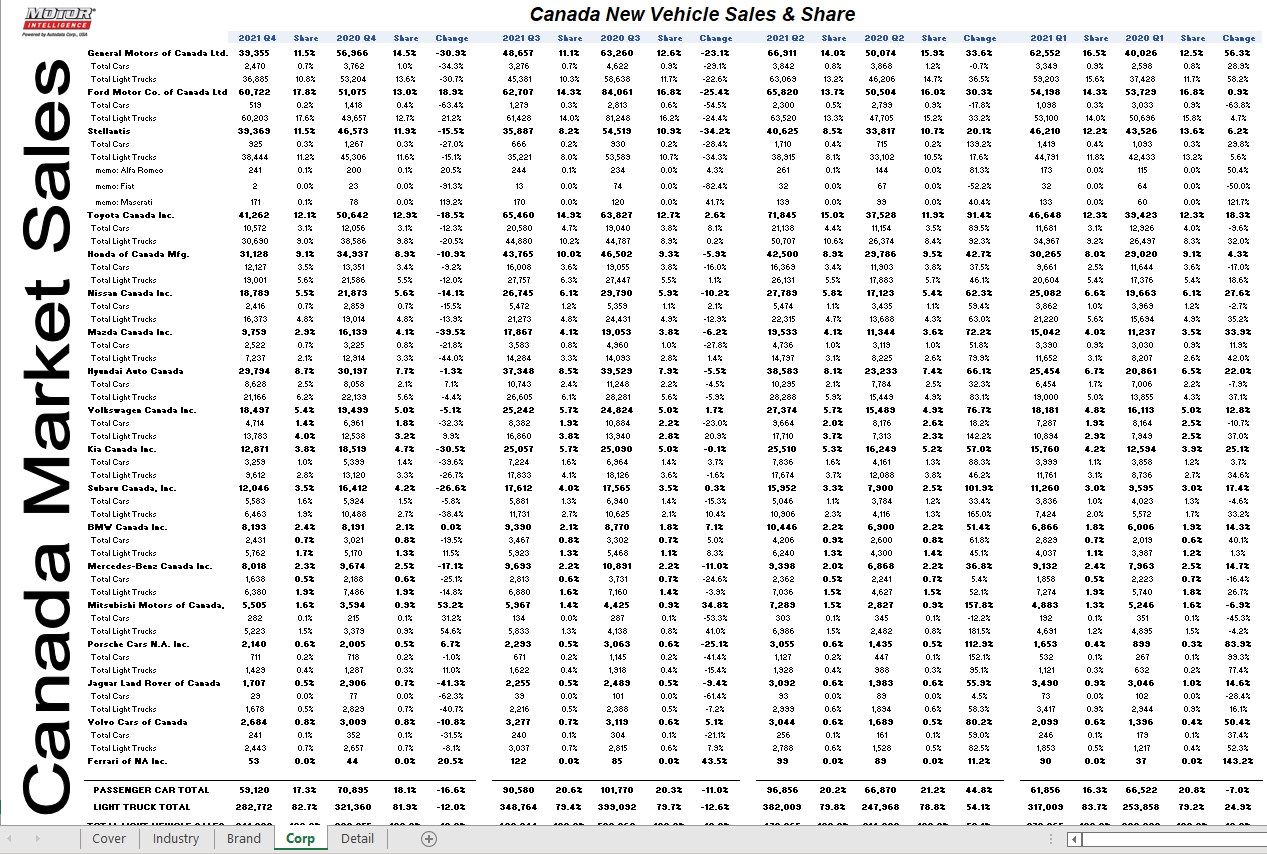
Quarterly Canada Sales Report
$1,200 Annually
CLICK TO OPEN IN NEW TAB
Quarterly Canadian new vehicle sales, market share and percent change over the last 4 quarters broken out by:
- Car / Truck / Total
- Industry / Corporation / Brand / Series Detail
Monthly U.S. Market CPO Sales Report
Statistical Reporting Packages Starting at $4,900
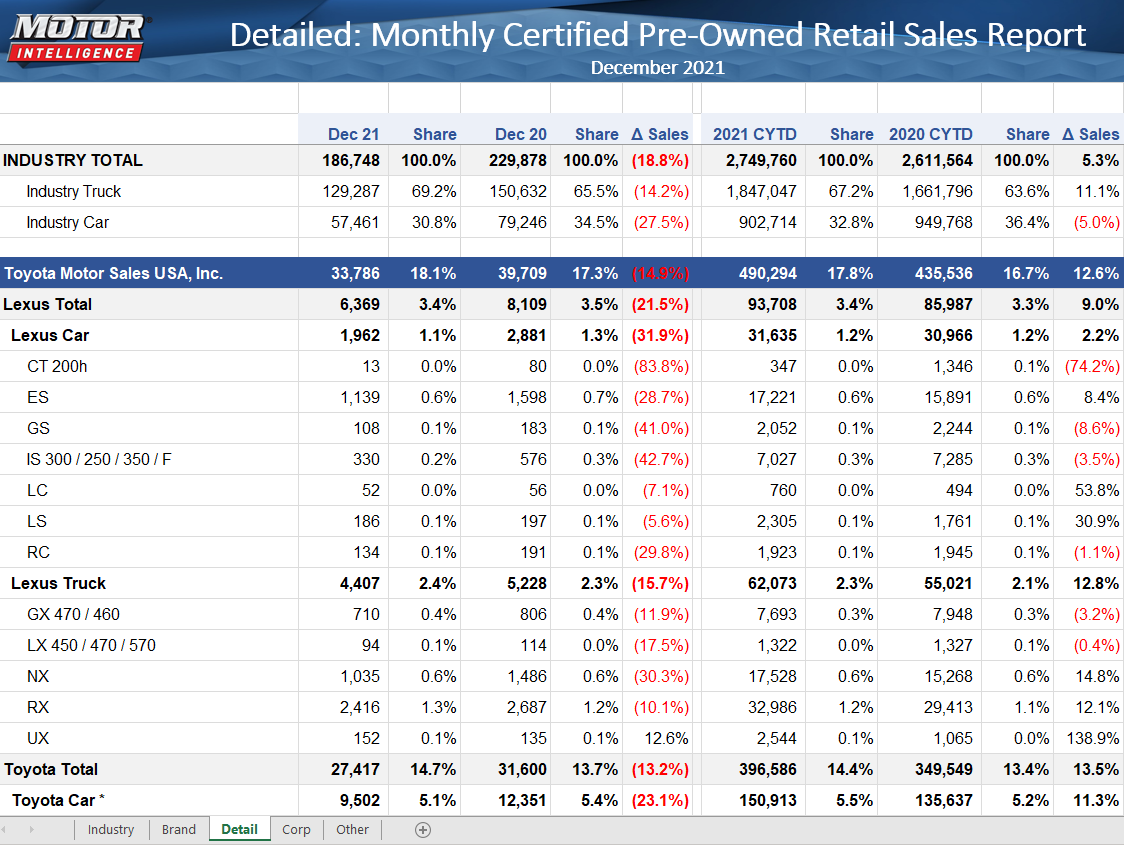
CLICK TO OPEN IN NEW TAB
Monthly U.S. Certified Pre-Owned vehicle sales, market share, percent of segment and percent change over current month vs prior year month and current CYTD vs prior year CYTD broken out by:
- Car / Truck / Total
- Industry / Corporation / Brand / Series Detail
- Totals for Mfg. Origin
Quarterly U.S. Market CPO Sales Report
Statistical Reporting Packages Starting at $4,900
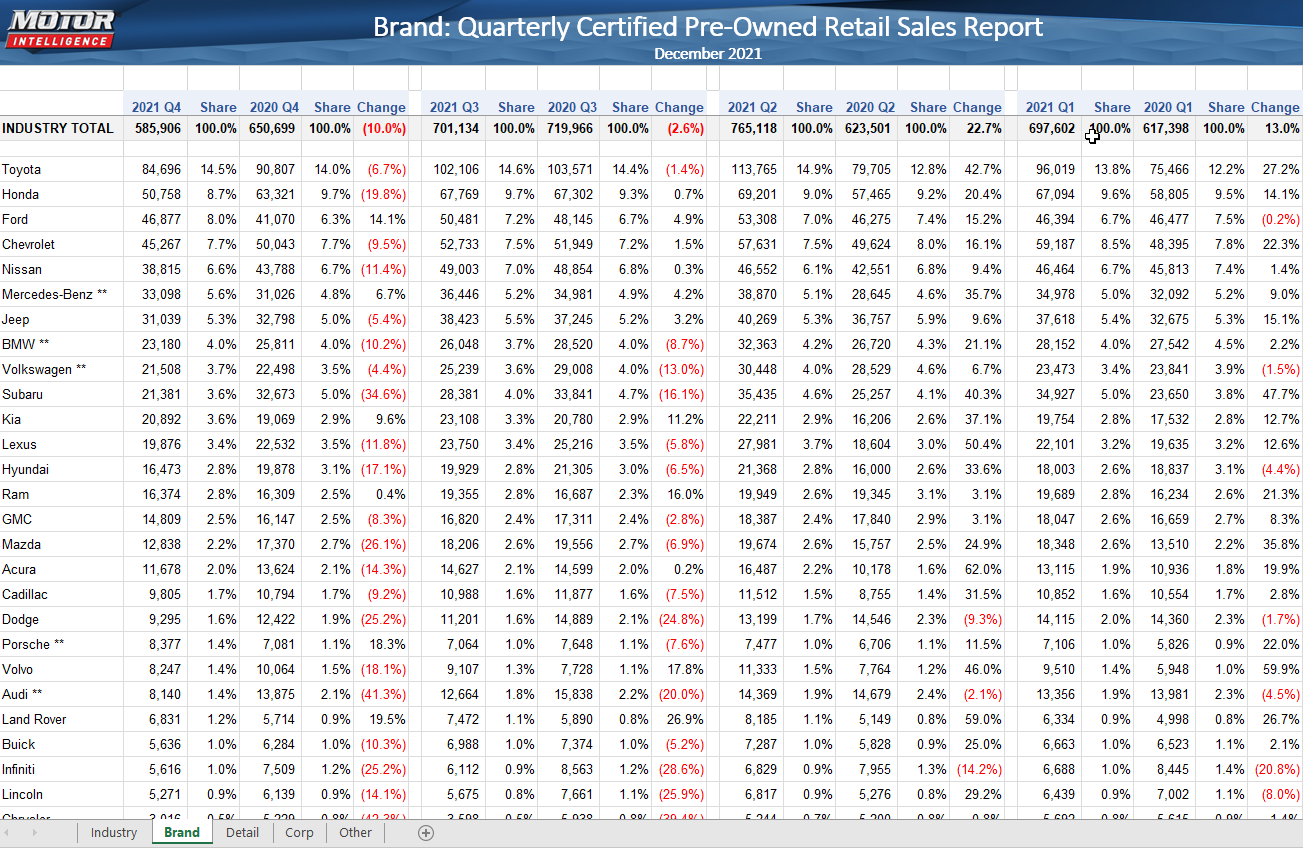
CLICK TO OPEN IN NEW TAB
Quarterly U.S. Certified-Preowned vehicle sales, market share and percent change over the last 4 quarters broken out by:
- Car / Truck / Total
- Industry / Corporation / Brand / Series Detail
- Totals for Mfg. Origin
STOCK REPORTING
Monthly U.S. Sales & Stock Report
Statistical Reporting Packages Starting at $4,900
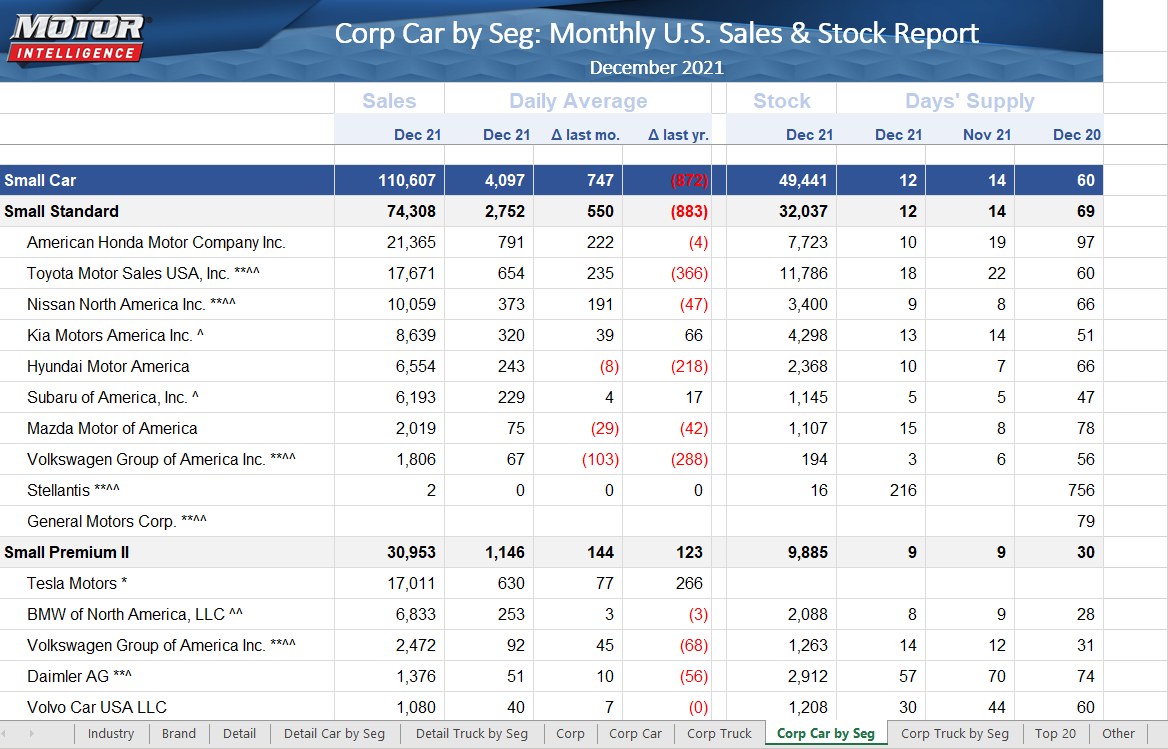
CLICK TO OPEN IN NEW TAB
Monthly U.S. new vehicle sales, dealer stock inventory, current daily average including change from prior month and prior year, and days supply for current month, prior month and prior year ago month broken out by:
- Car / Truck / Total
- Industry / Corporation / Brand / Series Detail
- Detailed Statistics of Corporation & Series Car / Truck by Vehicle Segment
- Totals for Heavy Vehicles by Corp. / Mfg. Origin / Sourcing by Domestic N.A. vs Imports
- Top 20 Vehicles
Quarterly U.S. Stock Report
Statistical Reporting Packages Starting at $4,900
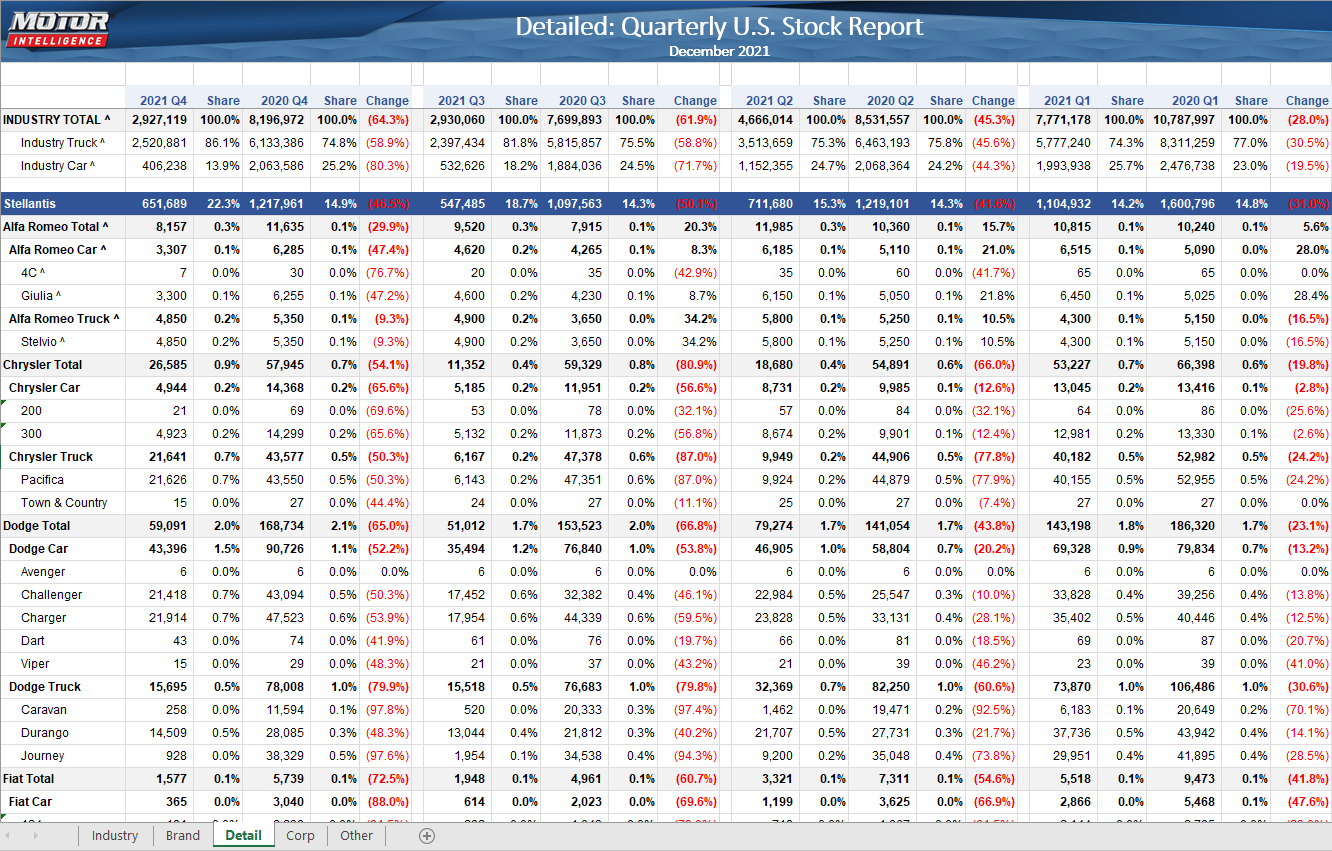
CLICK TO OPEN IN NEW TAB
Quarterly U.S. new vehicle dealer stock inventory, market share and percent change over the last 4 quarters broken out by:
- Car / Truck / Total
- Industry / Corporation / Brand / Series Detail
- Totals for Heavy Vehicles by Corp. / Mfg. Origin / Sourcing by Domestic N.A. vs Imports
PRODUCTION REPORTING
Monthly North American Production by Plant Report
N.A. Production Reporting Package $2,400 Annually
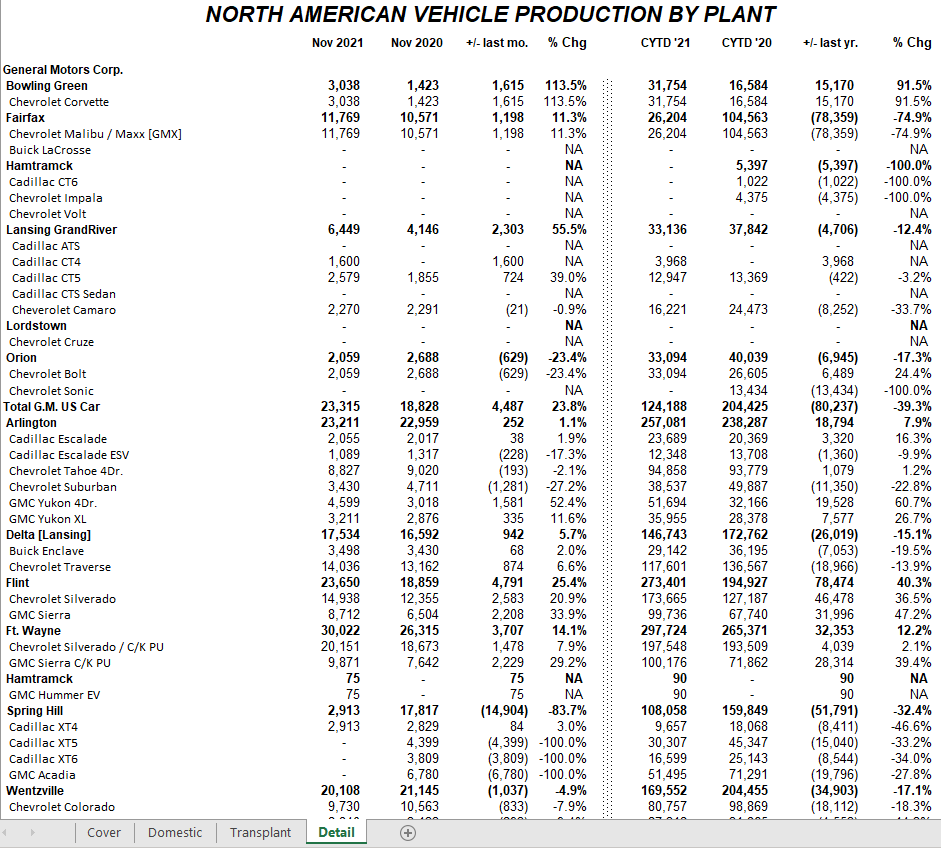
CLICK TO OPEN IN NEW TAB
Monthly North American new vehicle production by plant including percent change for current month vs prior year month and current CYTD vs prior year CYTD broken out by:
- Car / Truck / Total
- Industry / Corporation / Brand / Series Detail
- Totals for Domestic / Transplants / Sourcing by World Region
Monthly Production by Manufacturer Report
N.A. Production Reporting Package $2,400 Annually
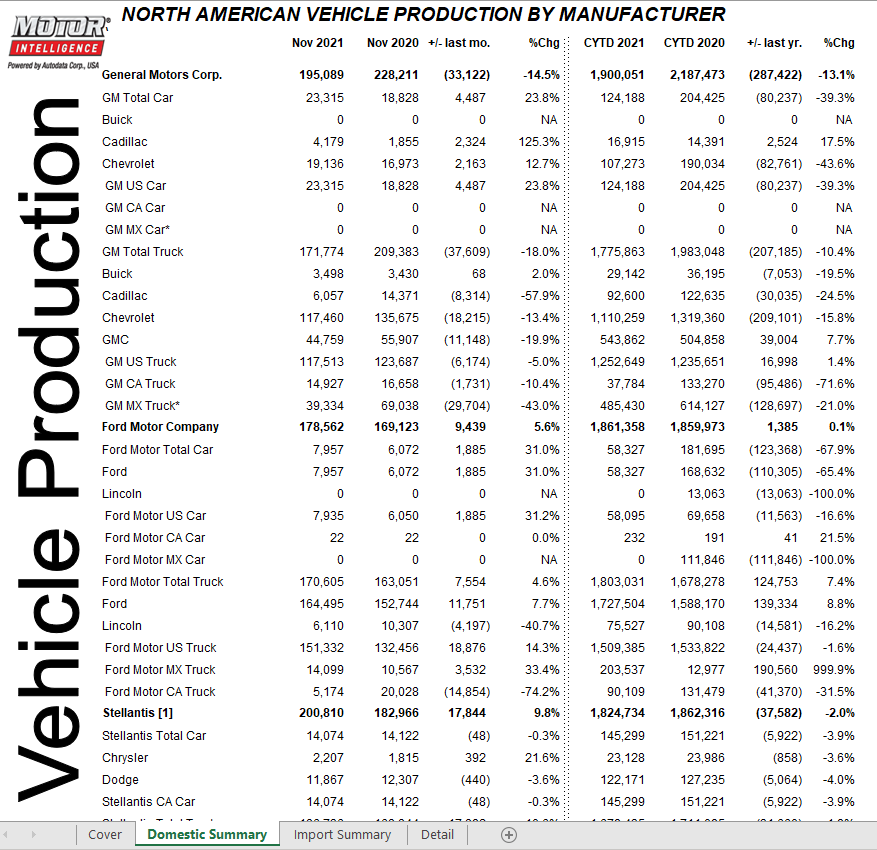
CLICK TO OPEN IN NEW TAB
Monthly North American new vehicle production by manufacturer including percent change for current month vs prior year month and current CYTD vs prior year CYTD broken out by:
- Car / Truck / Total
- Industry / Corporation / Brand / Series Detail
- Totals for Domestic / Import / Mfg Origin
|